
State Bank of India
NSE: SBI
Large CapBank
₹813.00As of July 02, 2025
State Bank of India
Research Report Summary
Date
2025-07-02
CMP
₹813
Buy Zone
₹780-800
Sell/Trim Zone
₹900+
Why Invest in SBI? Key Highlights
Undisputed Market Leader
As India’s largest lender, SBI leverages its immense scale and brand trust to maintain a significant competitive advantage.
Compelling Valuation
Trading at a P/E of 9.44, far below the sector average, offering a strong value proposition with potential for re-rating.
Robust Financial Health
A high ROE of 17.2%, improving asset quality, and a solid capital base signal a resilient and profitable operation.
Institutional Stability
High promoter holding (57.5%) ensures stability, complemented by strong confidence from domestic and foreign institutions.
Financial Snapshot
P/E Ratio9.44
P/B Ratio1.45
Sector P/E17.45
Div Yield1.94%
ROE17.2%
Debt to Equity12.4*
52W High₹899
52W Low₹680
Technical Outlook
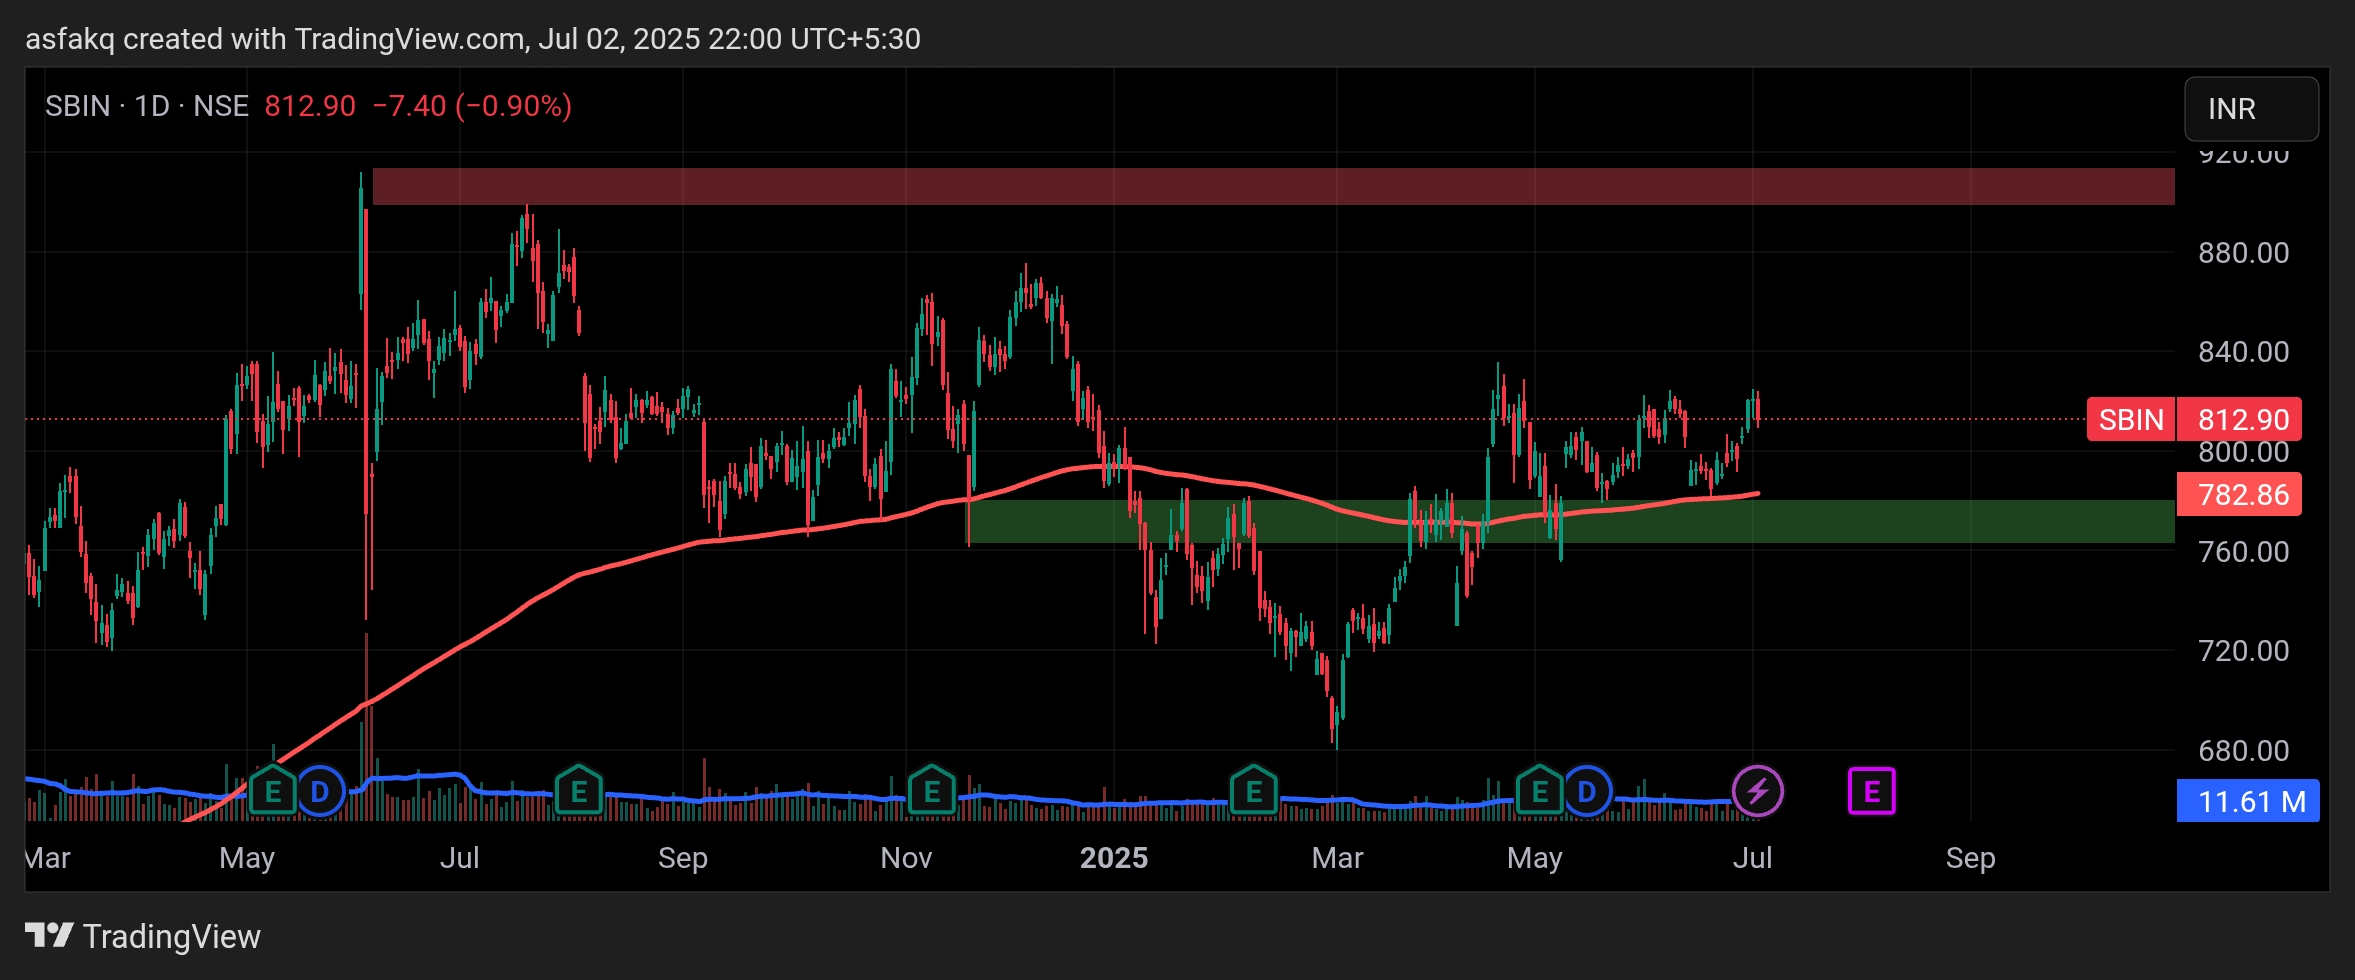
SUPPORT
₹780 – ₹800
RESISTANCE
₹900- ₹910
Detailed Analysis: Positives & Risks
Positives
- Attractive Valuation: Stock is trading at a low P/E ratio compared to the sector average.
- Strong Asset Quality: Credit costs remain below the long-term average, indicating healthy assets.
- Healthy Returns: Return on Equity (ROE) is strong at 17.2%, showing efficient profitability.
- Robust Capitalization: A high CET-1 ratio provides a strong capital buffer against risks.
Risks & Concerns
- Margin Pressure: Net Interest Margin (NIM) has seen a y-o-y decline, impacting core profits.
- Slowing Growth: Loan growth has moderated, suggesting a potential slowdown or competition.
- Low ROCE: Return on Capital Employed is low, pointing to inefficiencies in overall capital use.
Peer Comparison (Banking Sector)
| Bank Name | CMP (₹) | P/E Ratio | P/B Ratio | ROE (%) |
|---|---|---|---|---|
| State Bank of India | 813.00 | 9.44 | 1.45 | 17.20 |
| Punjab National Bank | 111.00 | 6.81 | 0.97 | 15.17 |
| Canara Bank | 114.05 | 5.92 | 0.99 | 17.50 |
| Kotak Mahindra Bank | 2142 | 22.12 | 2.69 | 13.40 |
| Axis Bank | 1172.25 | 12.96 | 1.94 | 16.30 |
| Bank of Baroda | 242.55 | 6.01 | 0.87 | 15.53 |