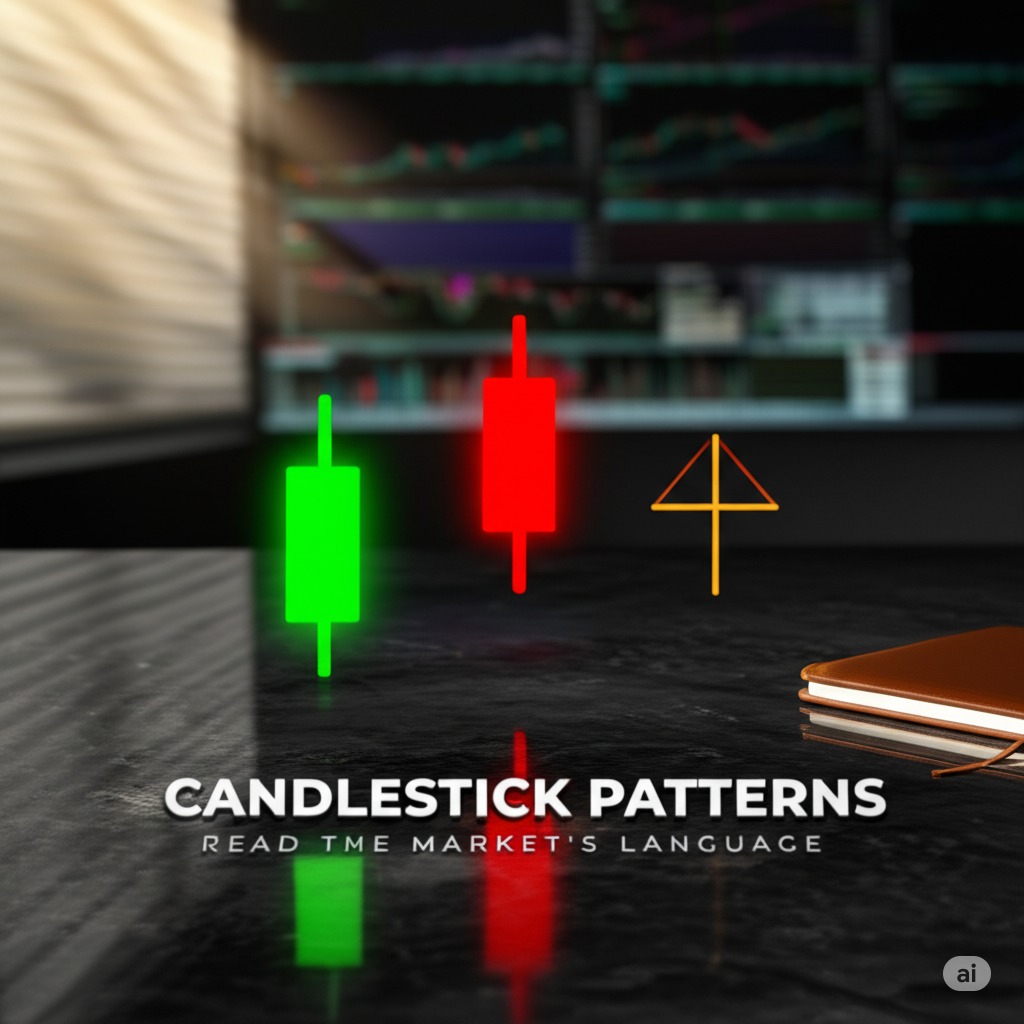
This article is part of our comprehensive trading course, Master the Art of Trading, designed to guide you step-by-step through market mastery.
In our previous article, we discussed how Trendlines and Channels help identify the direction of the market and important support/resistance zones. Once you’ve drawn those levels, the next crucial step is learning to read price action within those zones — and that’s where **Candlestick Patterns** come into play.
**Candlestick Patterns** offer visual clues about market psychology. They reveal who’s in control — buyers or sellers — and often hint at upcoming reversals or continuations.
Understanding Candlestick Patterns : The Basics
**Candlestick patterns** are formed by one or more candles that represent price behavior during a specific time frame (e.g., 5-min, 1-hour, daily). Traders use them to make short-term and long-term trading decisions.
Decoding Single Candlestick Patterns
✅ Doji
- Shape: Open ≈ Close, very small body.
- Signal: Indecision. Neither bulls nor bears are in control.
- Best Use: Near support/resistance zones or trendline breaks.
✅ Hammer
- Shape: Small body, long lower wick, little/no upper wick.
- Signal: Bullish Reversal after a downtrend.
- Note: Confirmation needed from the next bullish candle.
✅ Shooting Star
- Shape: Small body, long upper wick, little/no lower wick.
- Signal: Bearish Reversal after an uptrend.
✅ Spinning Top
- Shape: Small real body, long wicks on both sides.
- Signal: Market is in confusion. Watch for breakout direction.
Exploring Double Candlestick Formations
✅ Bullish Engulfing
- Structure: Small red candle followed by a larger green candle that engulfs the previous body.
- Signal: Strong bullish reversal.
✅ Bearish Engulfing
- Structure: Small green candle followed by a larger red candle that engulfs the previous body.
- Signal: Strong bearish reversal.
✅ Piercing Pattern
- Structure: Downtrend → Long red candle → Green candle opens gap-down but closes above midpoint of red candle.
- Signal: Potential bullish reversal.
✅ Dark Cloud Cover
- Structure: Uptrend → Long green candle → Red candle opens gap-up but closes below the midpoint of green candle.
- Signal: Potential bearish reversal.
Advanced Candlestick Patterns : The Hook
Hook patterns are subtle yet powerful price formations. They’re usually not taught in basic **candlestick** books but are incredibly useful in trend continuation setups.
🔸 Bullish Hook
- Appears after a minor pullback in an uptrend.
- Small red candles followed by a strong green candle near trendline or moving average.
- Looks like the price is “hooking” back to the trend.
🔸 Bearish Hook
- Appears after a minor bounce in a downtrend.
- Small green candles followed by a strong red candle.
- Suggests a trap for buyers and continuation of the downtrend.
- Where to Use It: Near trendlines and channels, especially if you’re using them as discussed in our previous article.
Tips for Effective Candlestick Patterns Analysis
Never rely on a **candlestick pattern** alone. Always combine it with:
- Trendlines or channels
- Support/resistance
- Volume (optional but helpful)
- Look for confluence. For example: a hammer forming right at a trendline support is more powerful than a hammer in the middle of nowhere.
- Wait for confirmation. The next candle often validates or rejects the **candlestick pattern**.
Candlestick Pattern Summary Table
| Pattern | Type | Signal | Reliability |
|---|---|---|---|
| Doji | Single | Indecision | Medium |
| Hammer | Single | Bullish Reversal | High (with trendline) |
| Shooting Star | Single | Bearish Reversal | High (near resistance) |
| Bullish Engulfing | Double | Bullish Reversal | High |
| Bearish Engulfing | Double | Bearish Reversal | High |
| Bullish Hook | Multi-Bar | Continuation | Medium-High |
| Bearish Hook | Multi-Bar | Continuation | Medium-High |
Next Steps in Your Candlestick Journey
Now that you understand **candlestick patterns**, try this:
- 👉 Go back to your Trendline and Channel chart.
- 👉 Wait for price to approach a key level.
- 👉 Watch for **candlestick signals** near that level.
These **patterns**, when combined with solid technical tools, can give you clear entries and exits — with more confidence.
