After a sharp 3-day slide, Nifty showed signs of stability on Tuesday with a strong bounce from the 25,000 level. The price action near the demand zone indicates short-term support is holding well, but overhead resistance remains. As we head into the mid-week session, traders should focus on key breakout levels for directional clarity.
In this post, we break down the latest Nifty chart, share important support/resistance zones, and offer a practical trading outlook.
Market Mood Index
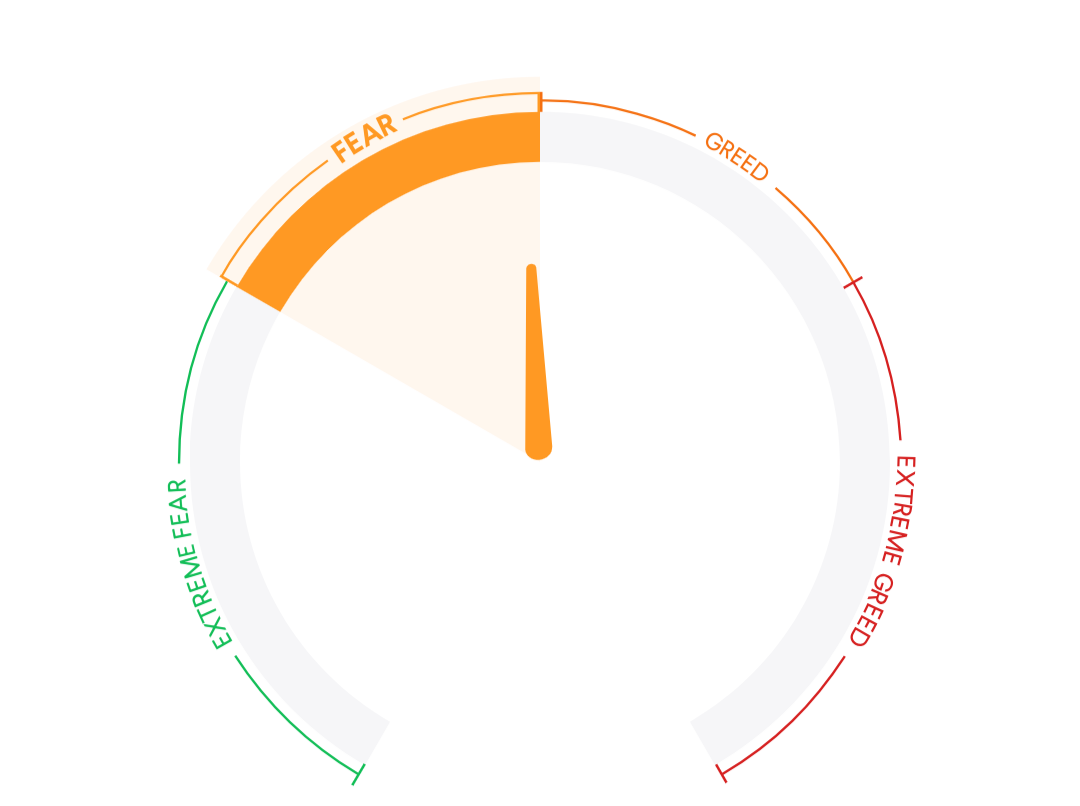
44.02
MMI is in the Fear Zone .it suggest that investors are acting Fearful in market.
Key Global Indices
As of 06:57 AM, 16 Jul
| Index/Asset | Country | Value | Change | Change (%) | |
|---|---|---|---|---|---|
| ↑ | GIFTNIFTY | India | 25177.00 | +9.50 | (+0.04%) |
| ↓ | DOW FUTURES | USA | 43975.00 | -47.90 | (-0.11%) |
| ↓ | DOW JONES | USA | 44023.28 | -436.38 | (-0.98%) |
| ↑ | NASDAQ | USA | 20676.91 | +36.59 | (+0.18%) |
| ↓ | S&P 500 | USA | 6243.10 | -25.46 | (-0.41%) |
Key Indian Indices
| Index/Asset | Country | Value | Change | Change (%) | |
|---|---|---|---|---|---|
| ↓ | INDIAVIX | India | 11.4800 | -0.5000 | -4.17% |
| ↑ | SENSEX | India | 82,570.91 | +317.45 | +0.39% |
| ↑ | NIFTY | India | 25,195.80 | +113.50 | +0.45% |
| ↑ | BANKNIFTY | India | 57,006.65 | +241.30 | +0.43% |
NIFTY50 – Pre-Market Analysis (July 16, 2025)
🗓 Nifty Pre-Market Outlook – July 16, 2025
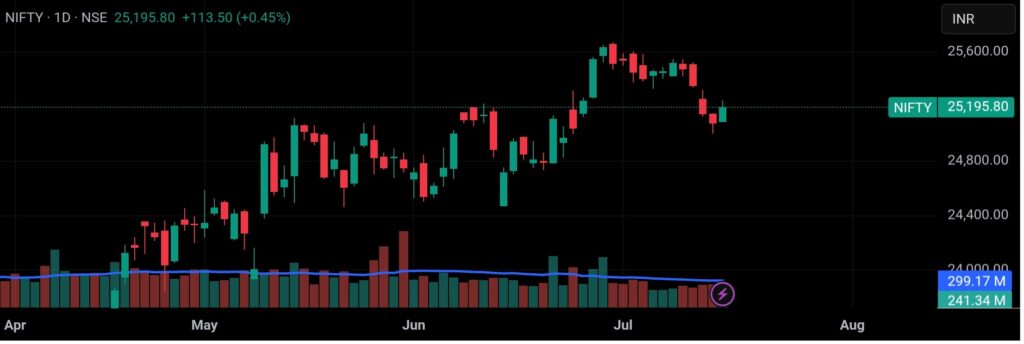
After a sharp correction over the past few sessions, Nifty bounced back smartly on Tuesday, closing at 25,195.80 with a gain of +113.50 points (+0.45%). The price respected the 24,750–25,000 demand zone, showing signs of short-term reversal.
Here’s a complete breakdown of what the chart tells us and how we plan to act next 👇
📊 Market Recap (July 15, 2025)
Nifty defended the demand zone after four consecutive red candles and formed a green recovery candle on decent volume.
While the index is still below the 21 EMA, the bounce suggests buyers are stepping in around key support zones.
Global markets were flat to mildly positive, and FIIs showed neutral participation.
📈 Chart Insights
📅 Daily Chart (1D)
- ✅ Price bounced near 24,900 zone – previously marked demand area
- ✅ 21 EMA (25,239) now acting as immediate resistance
- ✅ Price needs to close above 25,300 to shift sentiment positive again
- ✅ Volume slightly improved, but no aggressive buying seen yet
- ✅ Structure turning into range-bound consolidation between 24,800 and 25,400
🔮 Today’s Outlook – July 16, 2025
Nifty is likely to open with a slightly positive bias, but the 25,240–25,300 resistance may cap any sharp upside.
If the index sustains above 25,300 with volume, short covering may push it higher.
On the downside, support remains at 24,900–25,000. A break below that can drag Nifty to 24,750 again.
📌 Strategy: Wait for confirmation above 25,300 for bullish trades. Below 25,000, fresh shorts may emerge.
🔍 We’re still on the sidelines, tracking structure for our next credit spread setup.
📲 For Live Trade Ideas, Join Our WhatsApp Group:
👉 Join HereSmart Money Flows
| Date | FII | DII |
|---|---|---|
| 15 JUL | 120 | 1,555 |
| 14 JUL | -1,614 | 1,788 |
| 11 JUL | -5,104 | 3,559 |
| 10 JUL | 221 | 591 |
| 09 JUL | 77 | 921 |
📌 Wrapping Up
While Nifty has shown strength off support, it still faces strong resistance near 25,300. This is a time to observe, not chase, unless we see a breakout on strong volume. We’re staying cautious and waiting for a clear opportunity to re-enter with a well-defined credit spread or directional trade.📌 Want to receive real-time trade setups like our past credit spread ideas?👉 Join our WhatsApp Group for live market insights, trade ideas & stock research.Let’s trade smart. Stay updated, stay profitable. 💼📈
No new trades at the moment – we prefer to wait for clean setups rather than force entries.Patience is a position too.
📲 Join our community for live updates, trade ideas & analysis: