The markets closed the week on a bearish note, with Nifty slipping further below the key psychological level of 25,000. After Friday’s breakdown, selling pressure has intensified as bulls failed to reclaim control. Let’s break down the technical setup, volume dynamics, and key strategy for traders this week.
Market Mood Index
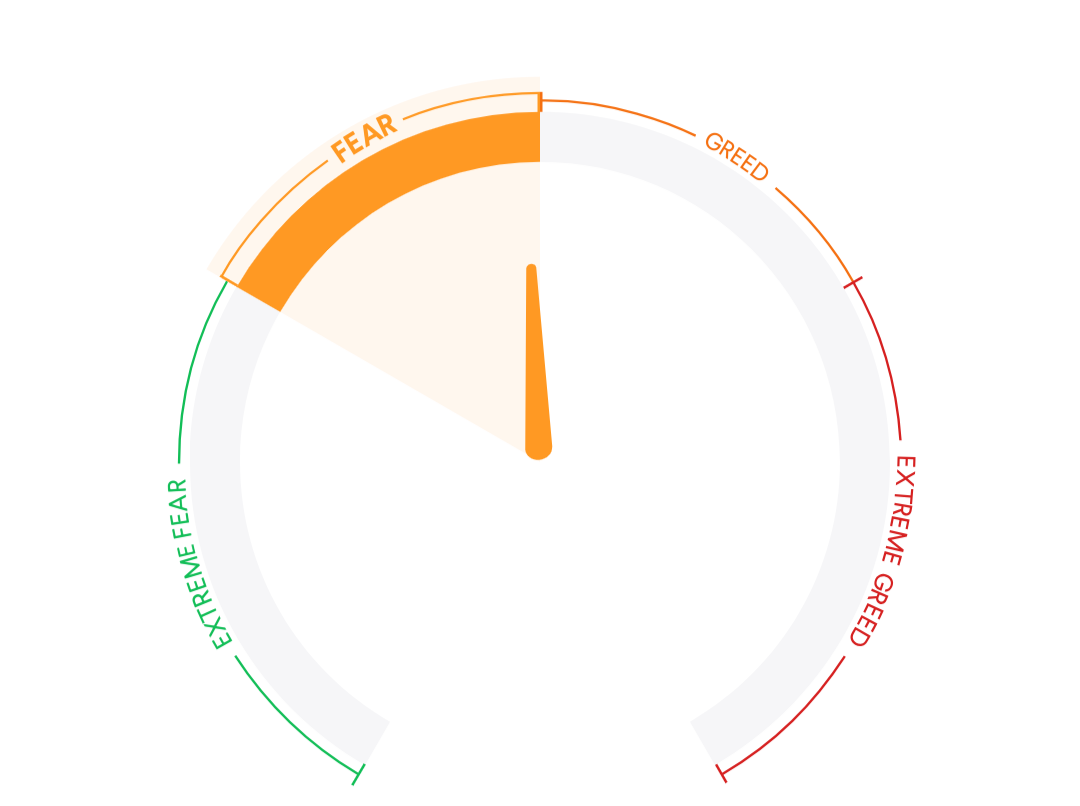
40.51
MMI is in the Fear Zone .it suggest that investors are acting Fearful in market.
Key Global Indices
As of 07:15 AM, July 21st
| Index/Asset | Country | Value | Change | Change (%) | |
|---|---|---|---|---|---|
| ↑ | GIFTNIFTY | India | 25026.50 | +5.00 | (+0.02%) |
| ↑ | DOW FUTURES | USA | 44380.00 | +37.80 | (+0.09%) |
| ↓ | DOW JONES | USA | 44342.18 | -142.32 | (-0.32%) |
| ↑ | NASDAQ | USA | 20893.01 | +7.37 | (+0.04%) |
| ↓ | S&P 500 | USA | 6296.68 | -0.68 | (-0.01%) |
Key Indian Indices
Indian Market Data
| Index/Asset | Country | Value | Change | Change (%) | |
|---|---|---|---|---|---|
| ↑ | INDIAVIX | India | 11.3925 | +0.1500 | +1.33% |
| ↓ | SENSEX | India | 81,757.73 | -501.51 | -0.61% |
| ↓ | NIFTY | India | 24,968.40 | -143.05 | -0.57% |
| ↓ | BANKNIFTY | India | 56,283.00 | -545.80 | -0.96% |
NIFTY50 – Pre-Market Analysis (July 21, 2025)
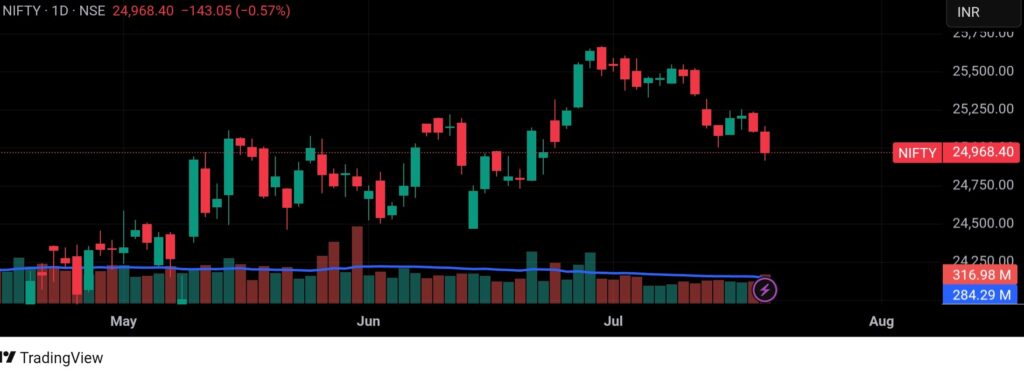
📊 Nifty Technical Analysis – July 21, 2025
Index Closing: 24,968.40 (🔻 -143.05 | -0.57%)
Candlestick Pattern: Strong bearish candle with wide range, confirming follow-through selling.
Volume: 316.98M (🔺 Higher than average volume, confirming downside strength)
EMA Levels:
Price is now trading decisively below the 21 EMA and is testing the 50 EMA zone.
This signals growing short-term weakness and potential shift in trend.
🔍 Key Technical Observations:
- Support Zone: 24,880–24,930 (being tested today)
- Resistance Zone: 25,100–25,225 (previous support turned resistance)
- Trend Bias: Bearish to Sideways in short term
⚔️ Strategy Setup (Bearish Bias):
After the breakdown of the 25,100 level on Friday, we maintain a bearish-to-neutral view.
🧠 Options Strategy Idea:
✅ Sell 25,500 CE
✅ Buy 25,100 CE (to hedge risk)
➤ View: Market likely to stay below 25,100 in the near term
📈 Featured Insight:
Don’t miss our latest stock research report on PFC (Power Finance Corporation) — one of the most promising setups in the current correction phase:
Smart Money Flows
FII and DII Data (₹ Cr.)
| Date | FII (₹ Cr.) | DII (₹ Cr.) |
|---|---|---|
| 18 JUL | 375 | 2,104 |
| 17 JUL | -3,694 | 2,821 |
| 16 JUL | -1,858 | 1,224 |
| 15 JUL | 120 | 1,555 |
| 14 JUL | -1,614 | 1,788 |
📌 Wrapping Up
With Nifty sliding under key short-term averages and volume expanding, it’s clear that bears are tightening their grip. Unless the index reclaims 25,100 quickly, more consolidation or even a deeper correction can’t be ruled out. Traders should stay cautious, follow levels strictly, and stick to defined risk strategies.
📲 Join our WhatsApp Group for intraday trade ideas, real-time updates, and smart strategies:
Live Market Insights & Trade Ideas – Tap to Join
Stay disciplined. Trade with logic, not emotion. ✅